
Day 2! I woke up excited to work on this and spent an hour on it before work.
Today’s progress
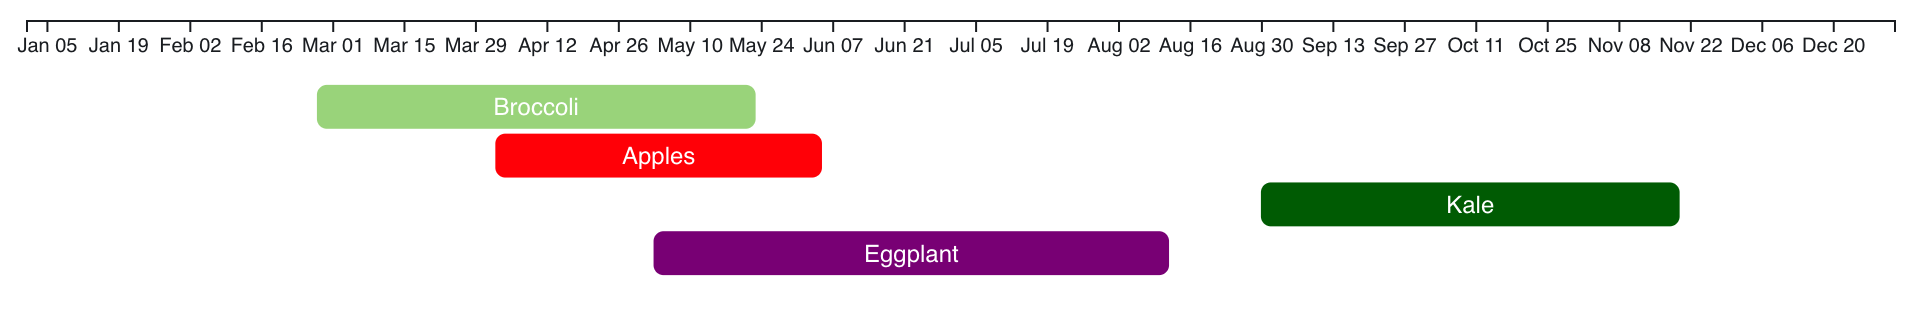
Figured out the basics of the D3 implementation for Plant Gantt:
- Learned how to use Observable
- The week-based X axis
- Stacking each plant similar to a horizontal bar chart and starting the bar at the correct start date
- Lining the labels up correctly
Here is the Observable notebook.
Tomorrow’s goal
Get back into Ember land and figure out how to incorporate a chart with mocked out data in an Ember component.